Debugging in lldb can be great. But sometimes, running commands manually becomes tedious. Fortunately, lldb provides a way to automate any action: Python scripts!
However, writing Python scripts without IDE support and a debugger is beneath any developer’s dignity. In this tutorial, I will show you how to set up PyCharm to take your lldb scripting experience to the next level. There will be:
PythonandPyCharmsetup forlldbscriptingPyCharmfix for process attachment on anarm64macOSPythonmodules injection for IDE and runtime support- Debugging breakpoints and commands in
PyCharm
Setting up PyCharm
Let’s start by creating a directory for the project:
$ mkdir lldb_scripts && cd lldb_scripts
Now we need a python environment. Create a virtual environment from the Xcode’s embedded Python used by the lldb:
$ sh -c 'exec "$(xcode-select -p)"/Library/Frameworks/Python3.framework/Versions/Current/bin/python3 -m venv python_env'
We also need lldb’s initialization file, so might as well link it to the project:
$ touch ~/.lldbinit && ln -s ~/.lldbinit lldbinit
Open the project in PyCharm. I am on a community edition:
$ open -a "PyCharm CE" .
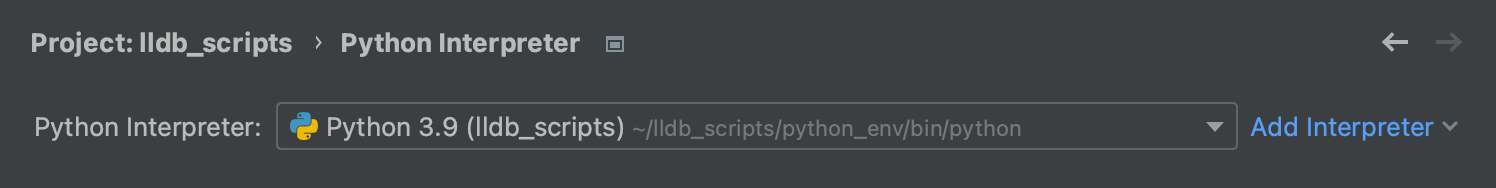
Go to project settings and make sure the project picked up the correct virtual environment from the python_env directory:
Script to debug
Now we need a script to debug. Make a test.py file with the following contents:
import os
import time

def test_loop(debugger, command, result, dict):
    print(f'lldb pid is: {os.getpid()}')
    while True:
        time.sleep(3)
        print(f'The time is: {time.time()}')

def __lldb_init_module(debugger, dict):
    module = os.path.splitext(os.path.basename(__file__))[0]
    function = test_loop.__name__
    print(f'\nRegistering {module}.{function}. Call "{function}" from lldb to run the script')
    debugger.HandleCommand(f'command script add -f {module}.{function} {function}')
    print(f'\nAttach to lldb at: {os.getpid()}')
And add the script import to the .lldbinit file:
command script import ~/lldb_scripts/test.py
The script is pretty simple:
__lldb_init_modulefunction is called when lldb is loaded- The function registers the
test_loopcommand in lldb - Calling
test_loopprints lldb’s pid and spins in an eternal loop printing time every 3 seconds
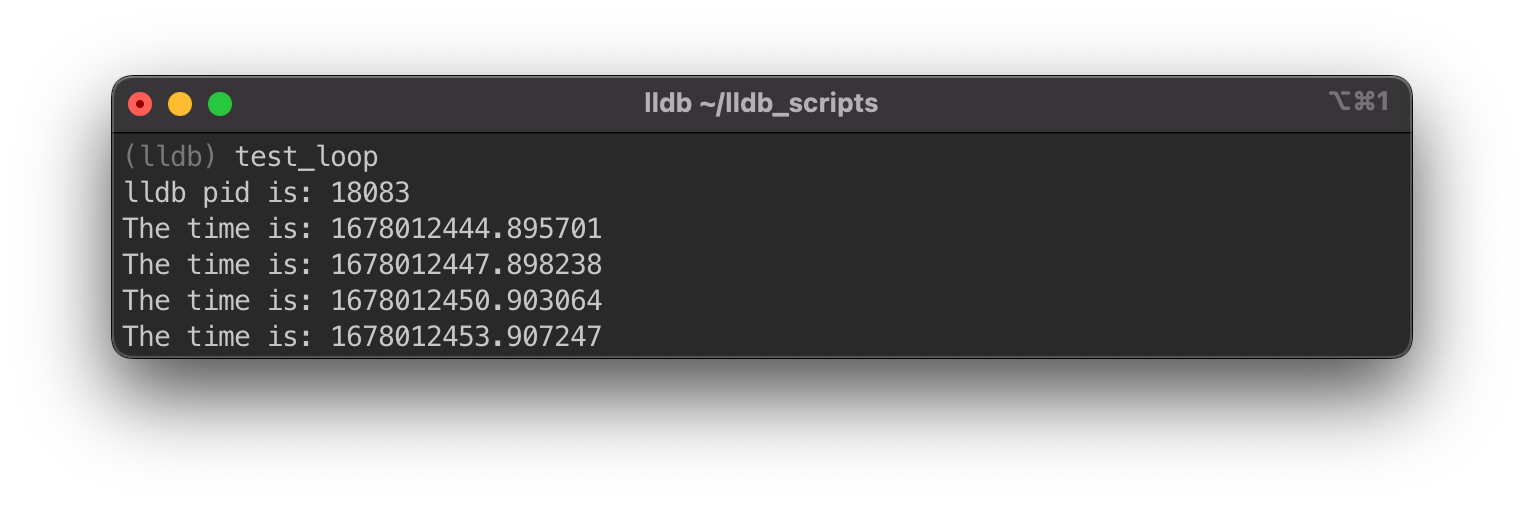
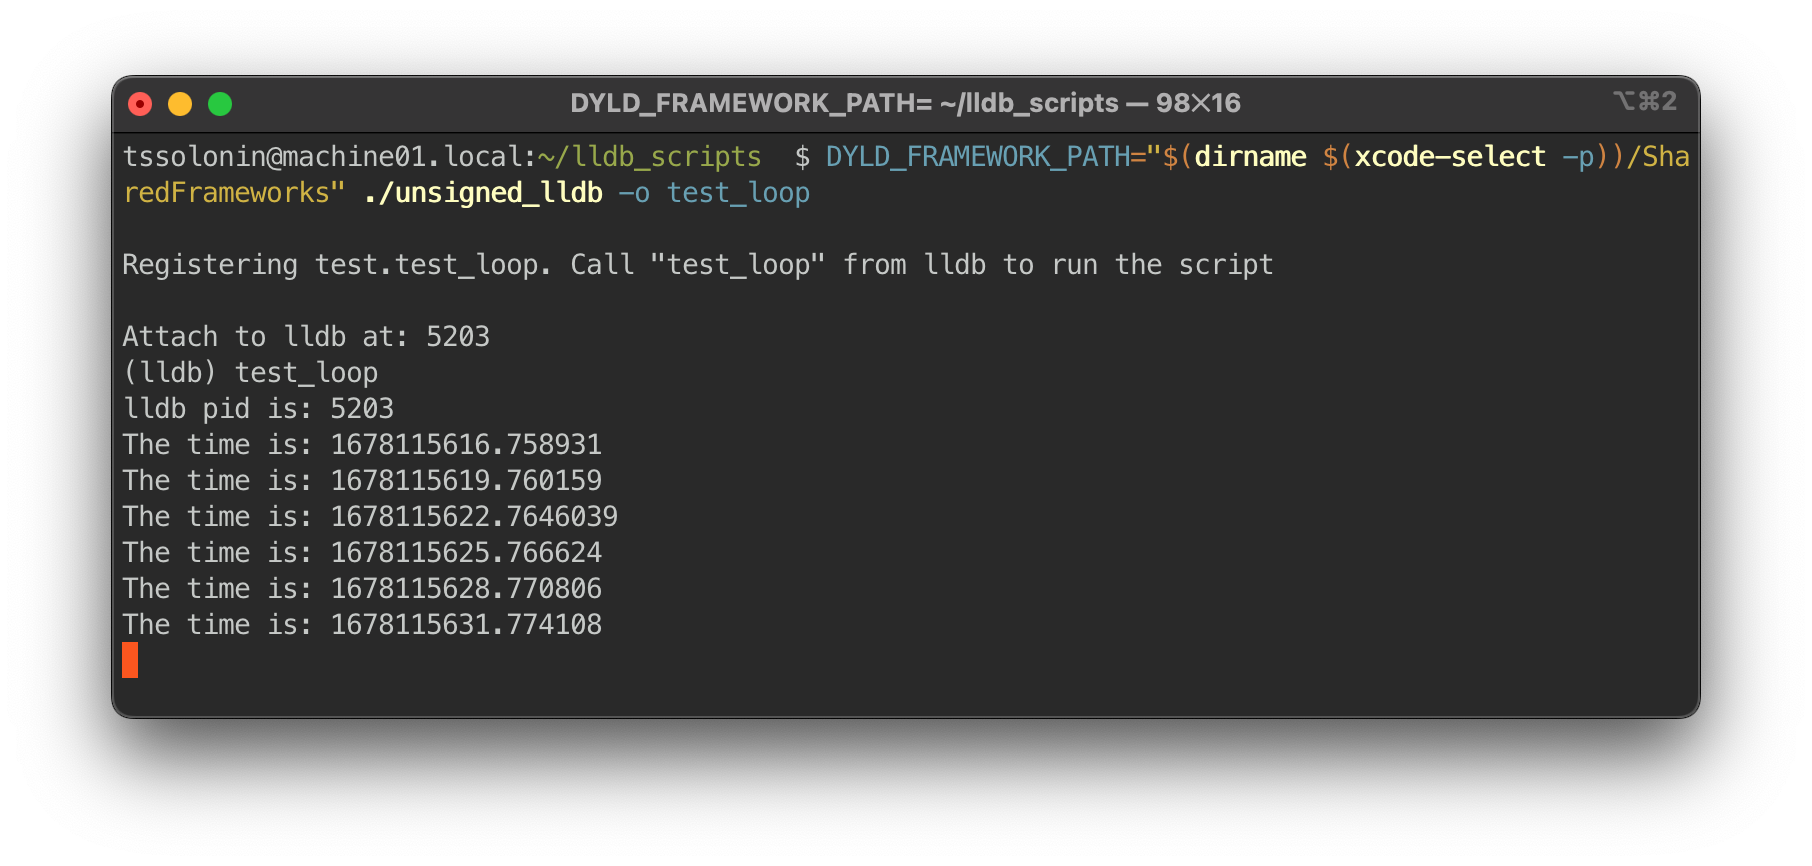
Start lldb and call the test_loop:
$ lldb -o test_loop
Hopefully, this is your output:
Attaching PyCharm to the script
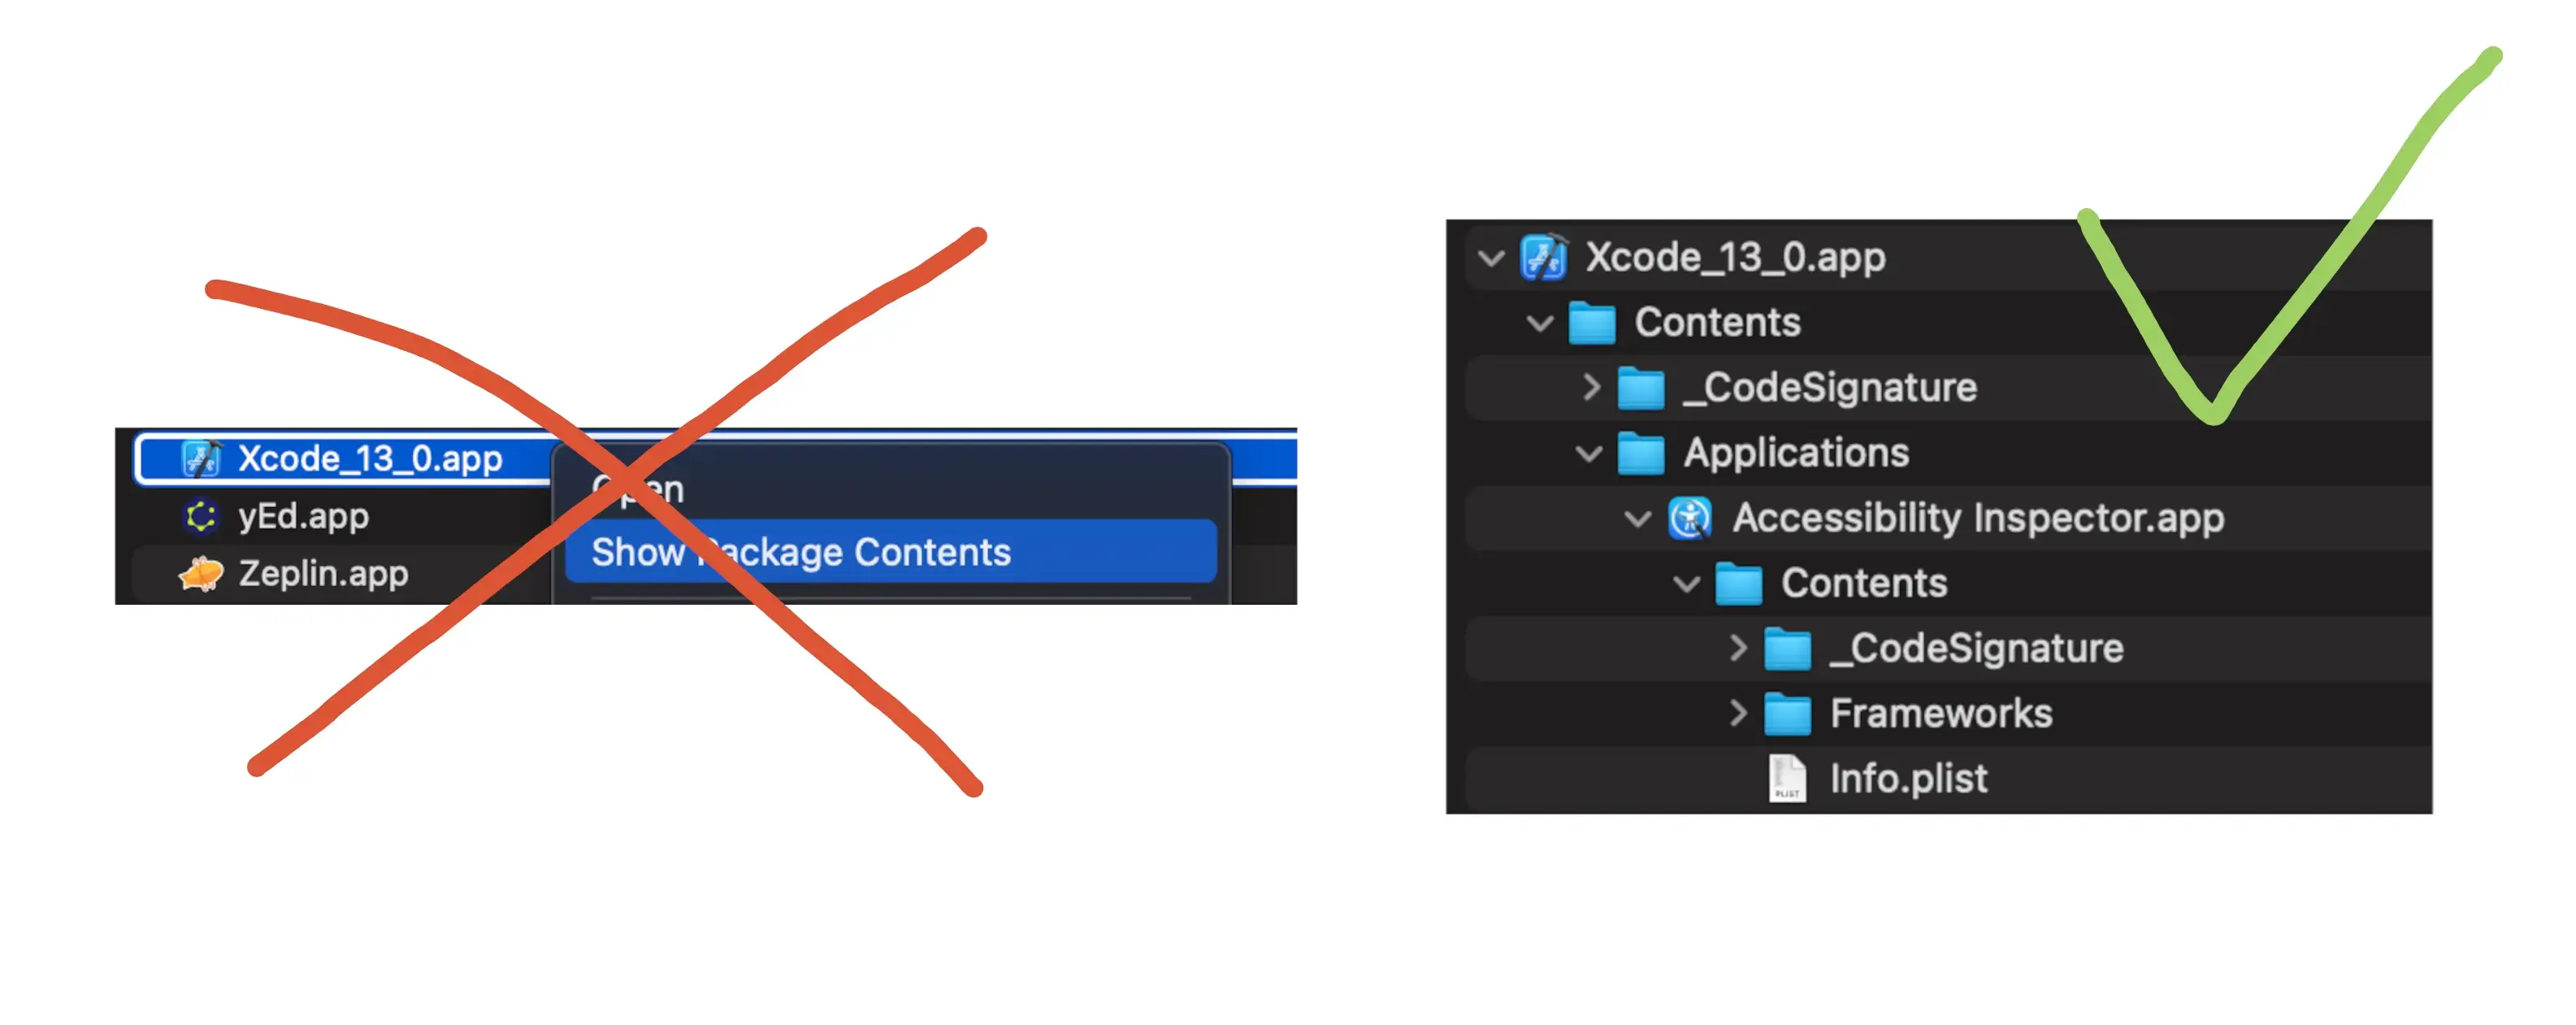
As always, things aren’t as simple as just running Attach To Process in PyCharm. lldb is signed to run with a hardened runtime, which means PyCharm won’t be able to attach. We need a copy of lldb with a stripped-down signature to bypass this restriction. Let’s make one:
$ cp "$(xcrun -f lldb)" unsigned_lldb && codesign --force --sign - unsigned_lldb
If you made the copy outside the Xcode’s bin directory, the rpath would be incorrect. To run this lldb, we must specify rpath explicitly. Run lldb again using:
$ DYLD_FRAMEWORK_PATH="$(dirname $(xcode-select -p))/SharedFrameworks" ./unsigned_lldb -o test_loop
To attach PyCharm, go to Run -> Attach To Process... and select the pid of the lldb process (i.e., 5203 from the output above).
If PyCharm doesn’t show any processes go to PyCharm -> Preferences... -> Build, Execution, Deployment -> Python Debugger and set the Attach To Process filter string to empty so that all processes are displayed.
On an Intel machine (or an arch -x86_64 lldb) PyCharm should attach and start outputting the timer in the debugger console. But many of us no longer work on Intel machines; on an arm machine, PyCharm will fail to attach.
Fixing a broken arm
Attaching to arm targets, as of PyCharm 2022.3.2, isn’t supported out of the box. Fortunately, the issue is relatively easy to workaround.
When PyCharm connects to a process, it injects and calls a library with a C function that links the debugger to the debuggee. PyCharm bundles only the x86_64 version of that library and, on attachment, futilely tries to inject the library into an arm process.
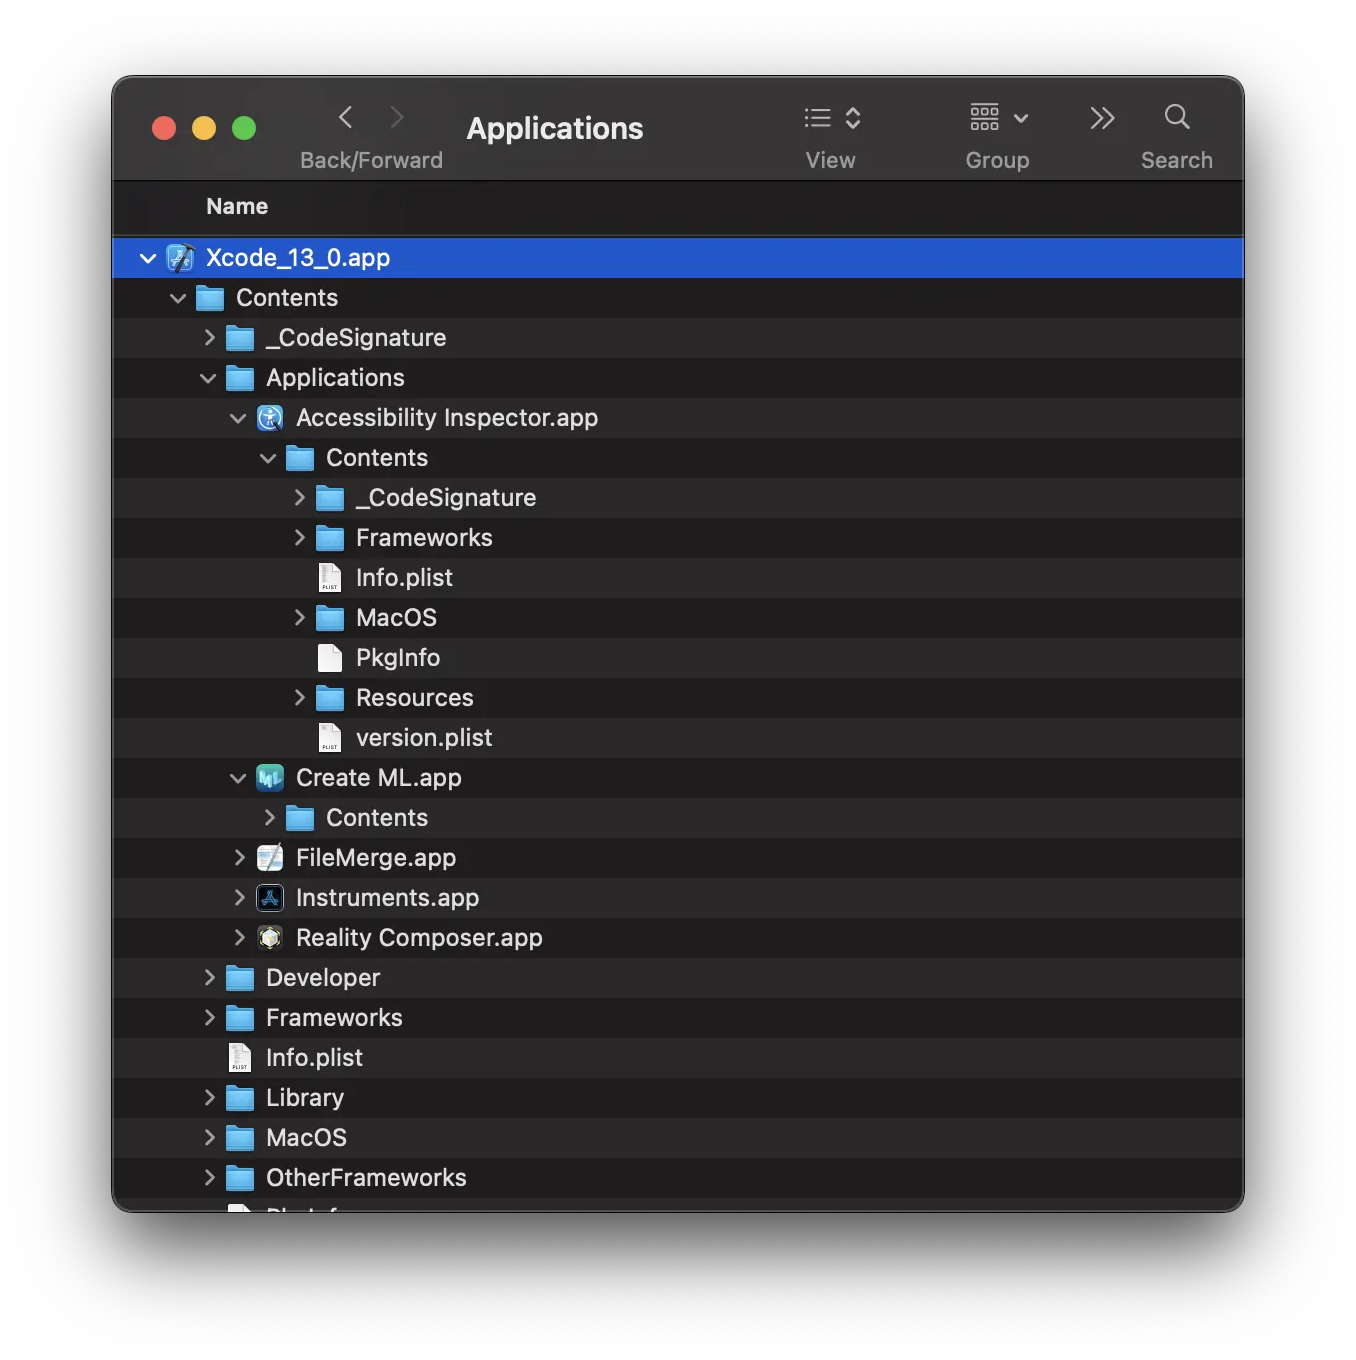
To fix the attachment process, we need to compile the library to run on arm and preload it into lldb before PyCharm tries to call the C function from the library. The sources for the library are shipped with PyCharm and can be found in:
$ cd "/Applications/PyCharm CE.app/Contents/plugins/python-ce/helpers/pydev/pydevd_attach_to_process/linux_and_mac"
A glance at compile_mac.sh reveals we need to substitute x86_64 for arm64, which should be enough to compile the library. Let’s compile and link:
g++ -fPIC -D_REENTRANT -std=c++11 -arch arm64 -c -o attach_arm64.o attach.cpp
g++ -dynamiclib -nostartfiles -arch arm64 -o attach_arm64.dylib attach_arm64.o -lc
We will use dlopen to preload the library straight from the test.py script. Add the following lines (make sure the dylib path matches your path):
import _ctypes
import platform
import os

def load_pydevd_library():
    processor = platform.processor()
    if processor != 'arm':
        print(f'lldb is running {processor} arch, skipping the arm fix')
        return

    library_handle = _ctypes.dlopen(
        '/Applications/PyCharm CE.app/Contents/plugins/python-ce/helpers/pydev/pydevd_attach_to_process/linux_and_mac/attach_arm64.dylib',
        os.RTLD_NOW
    )
    if library_handle == 0:
        print("Library didn't load")
        return
    print(f"Library handle is {hex(library_handle)}")

    function = 'DoAttach'
    do_attach_address = _ctypes.dlsym(library_handle, function)
    if do_attach_address == 0:
        print(f"Couldn't find {function} in library at {library_handle}")
        return
    print(f"{function} loaded at {hex(do_attach_address)}")

load_pydevd_library()
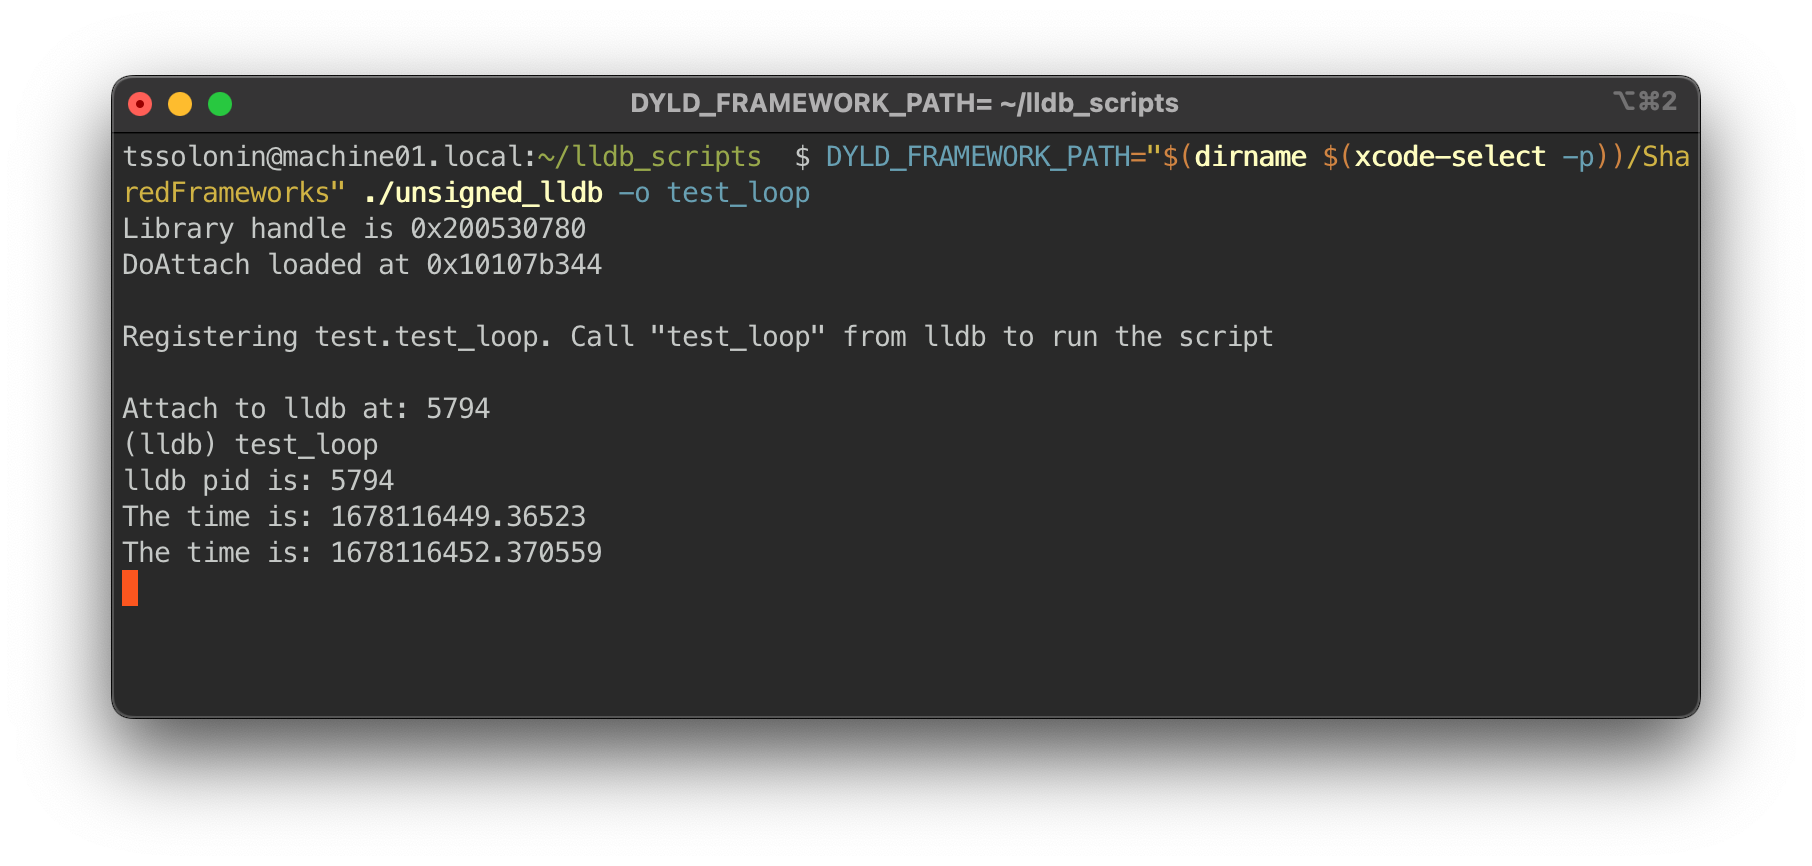
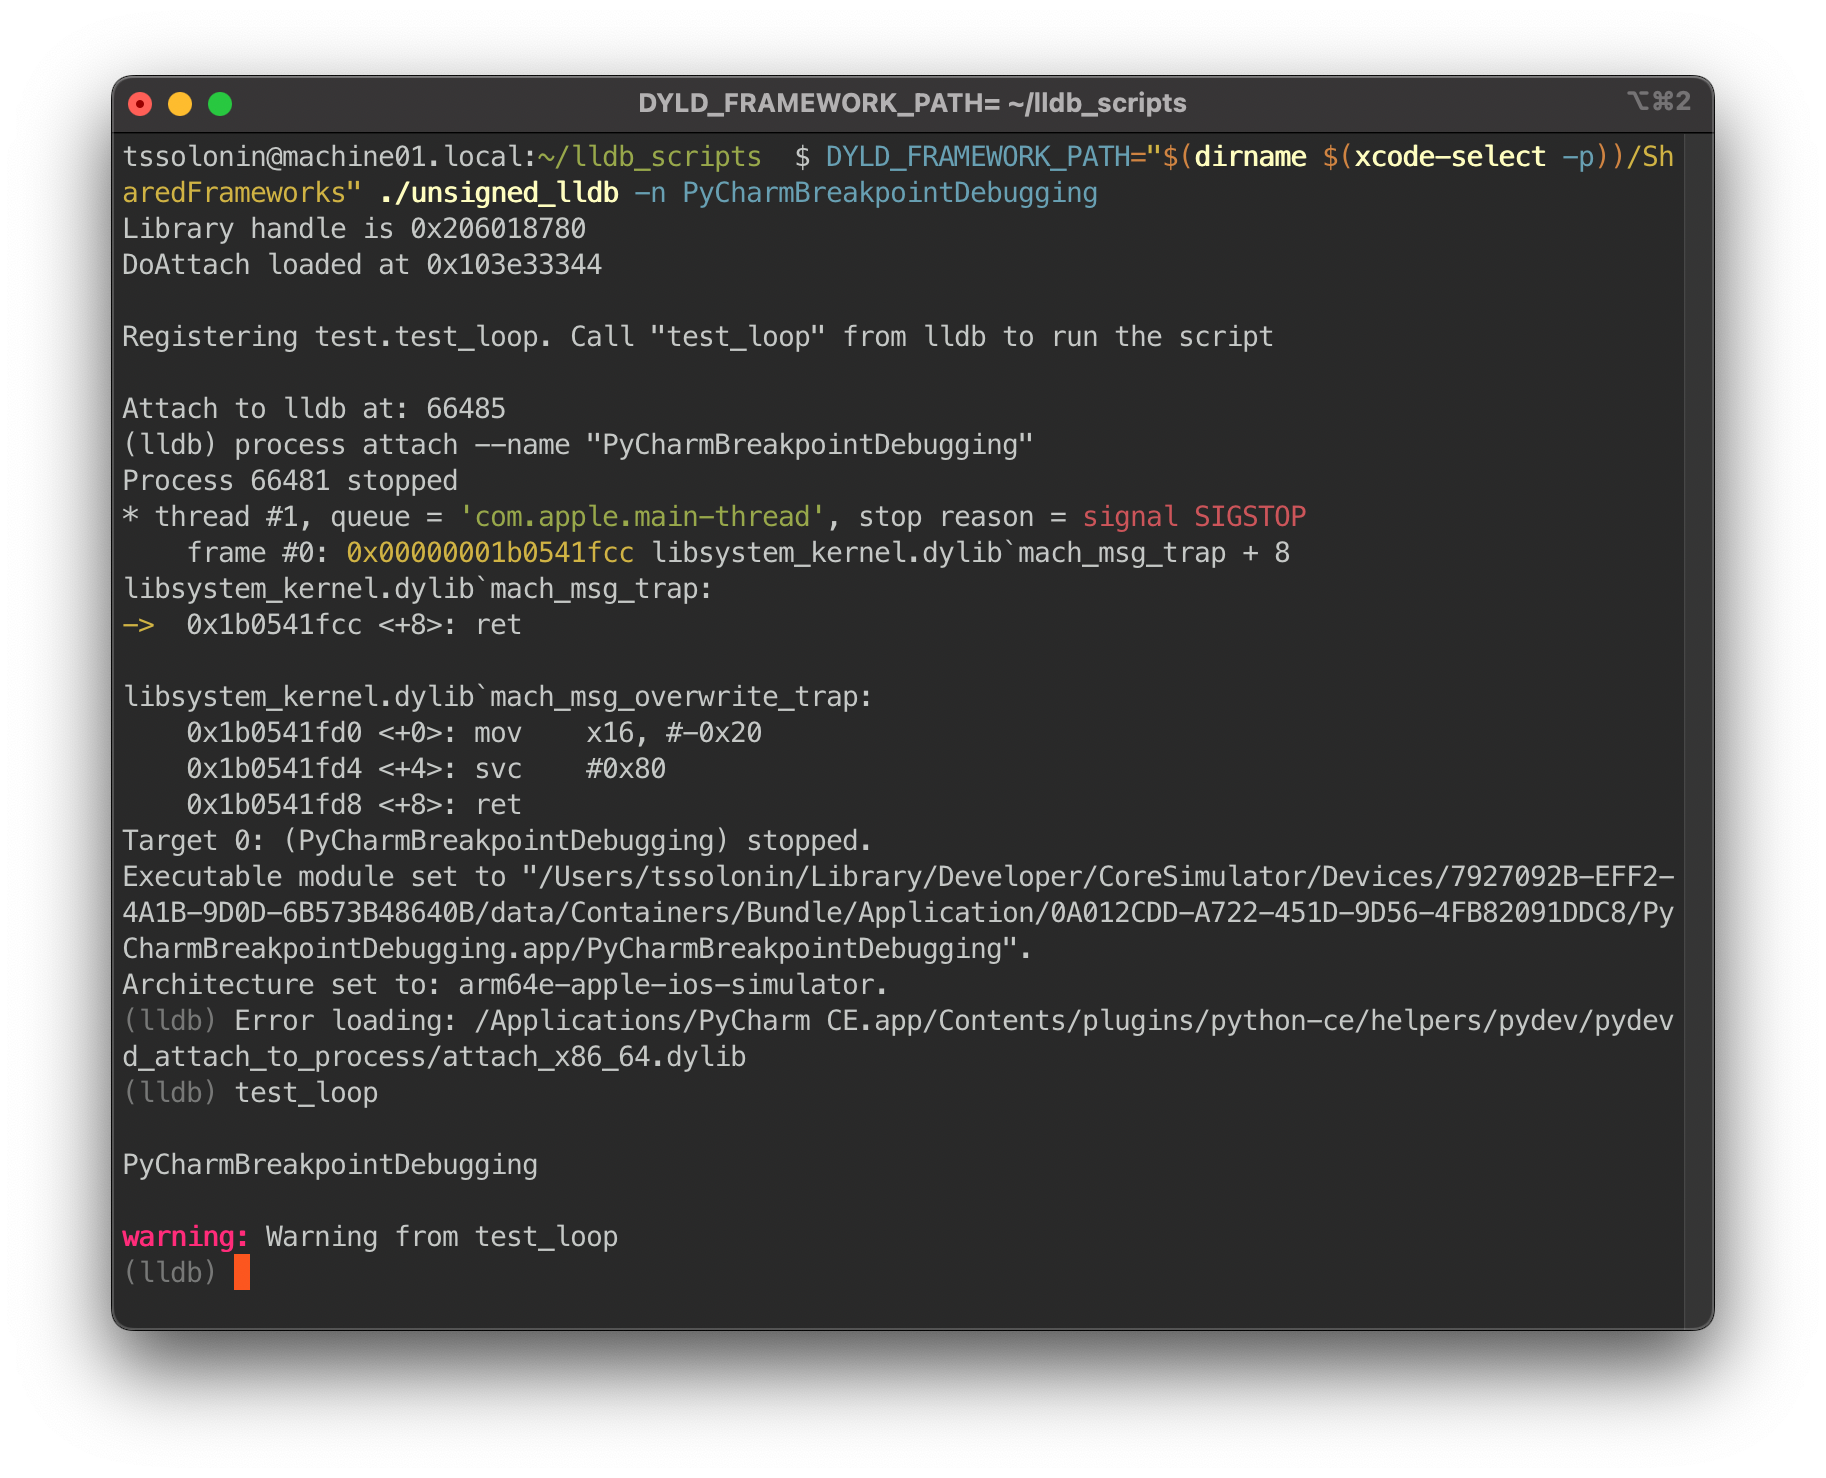
If you now run lldb, the library handle and the DoAttach function address will print out:
And attaching in PyCharm should finally work as expected:
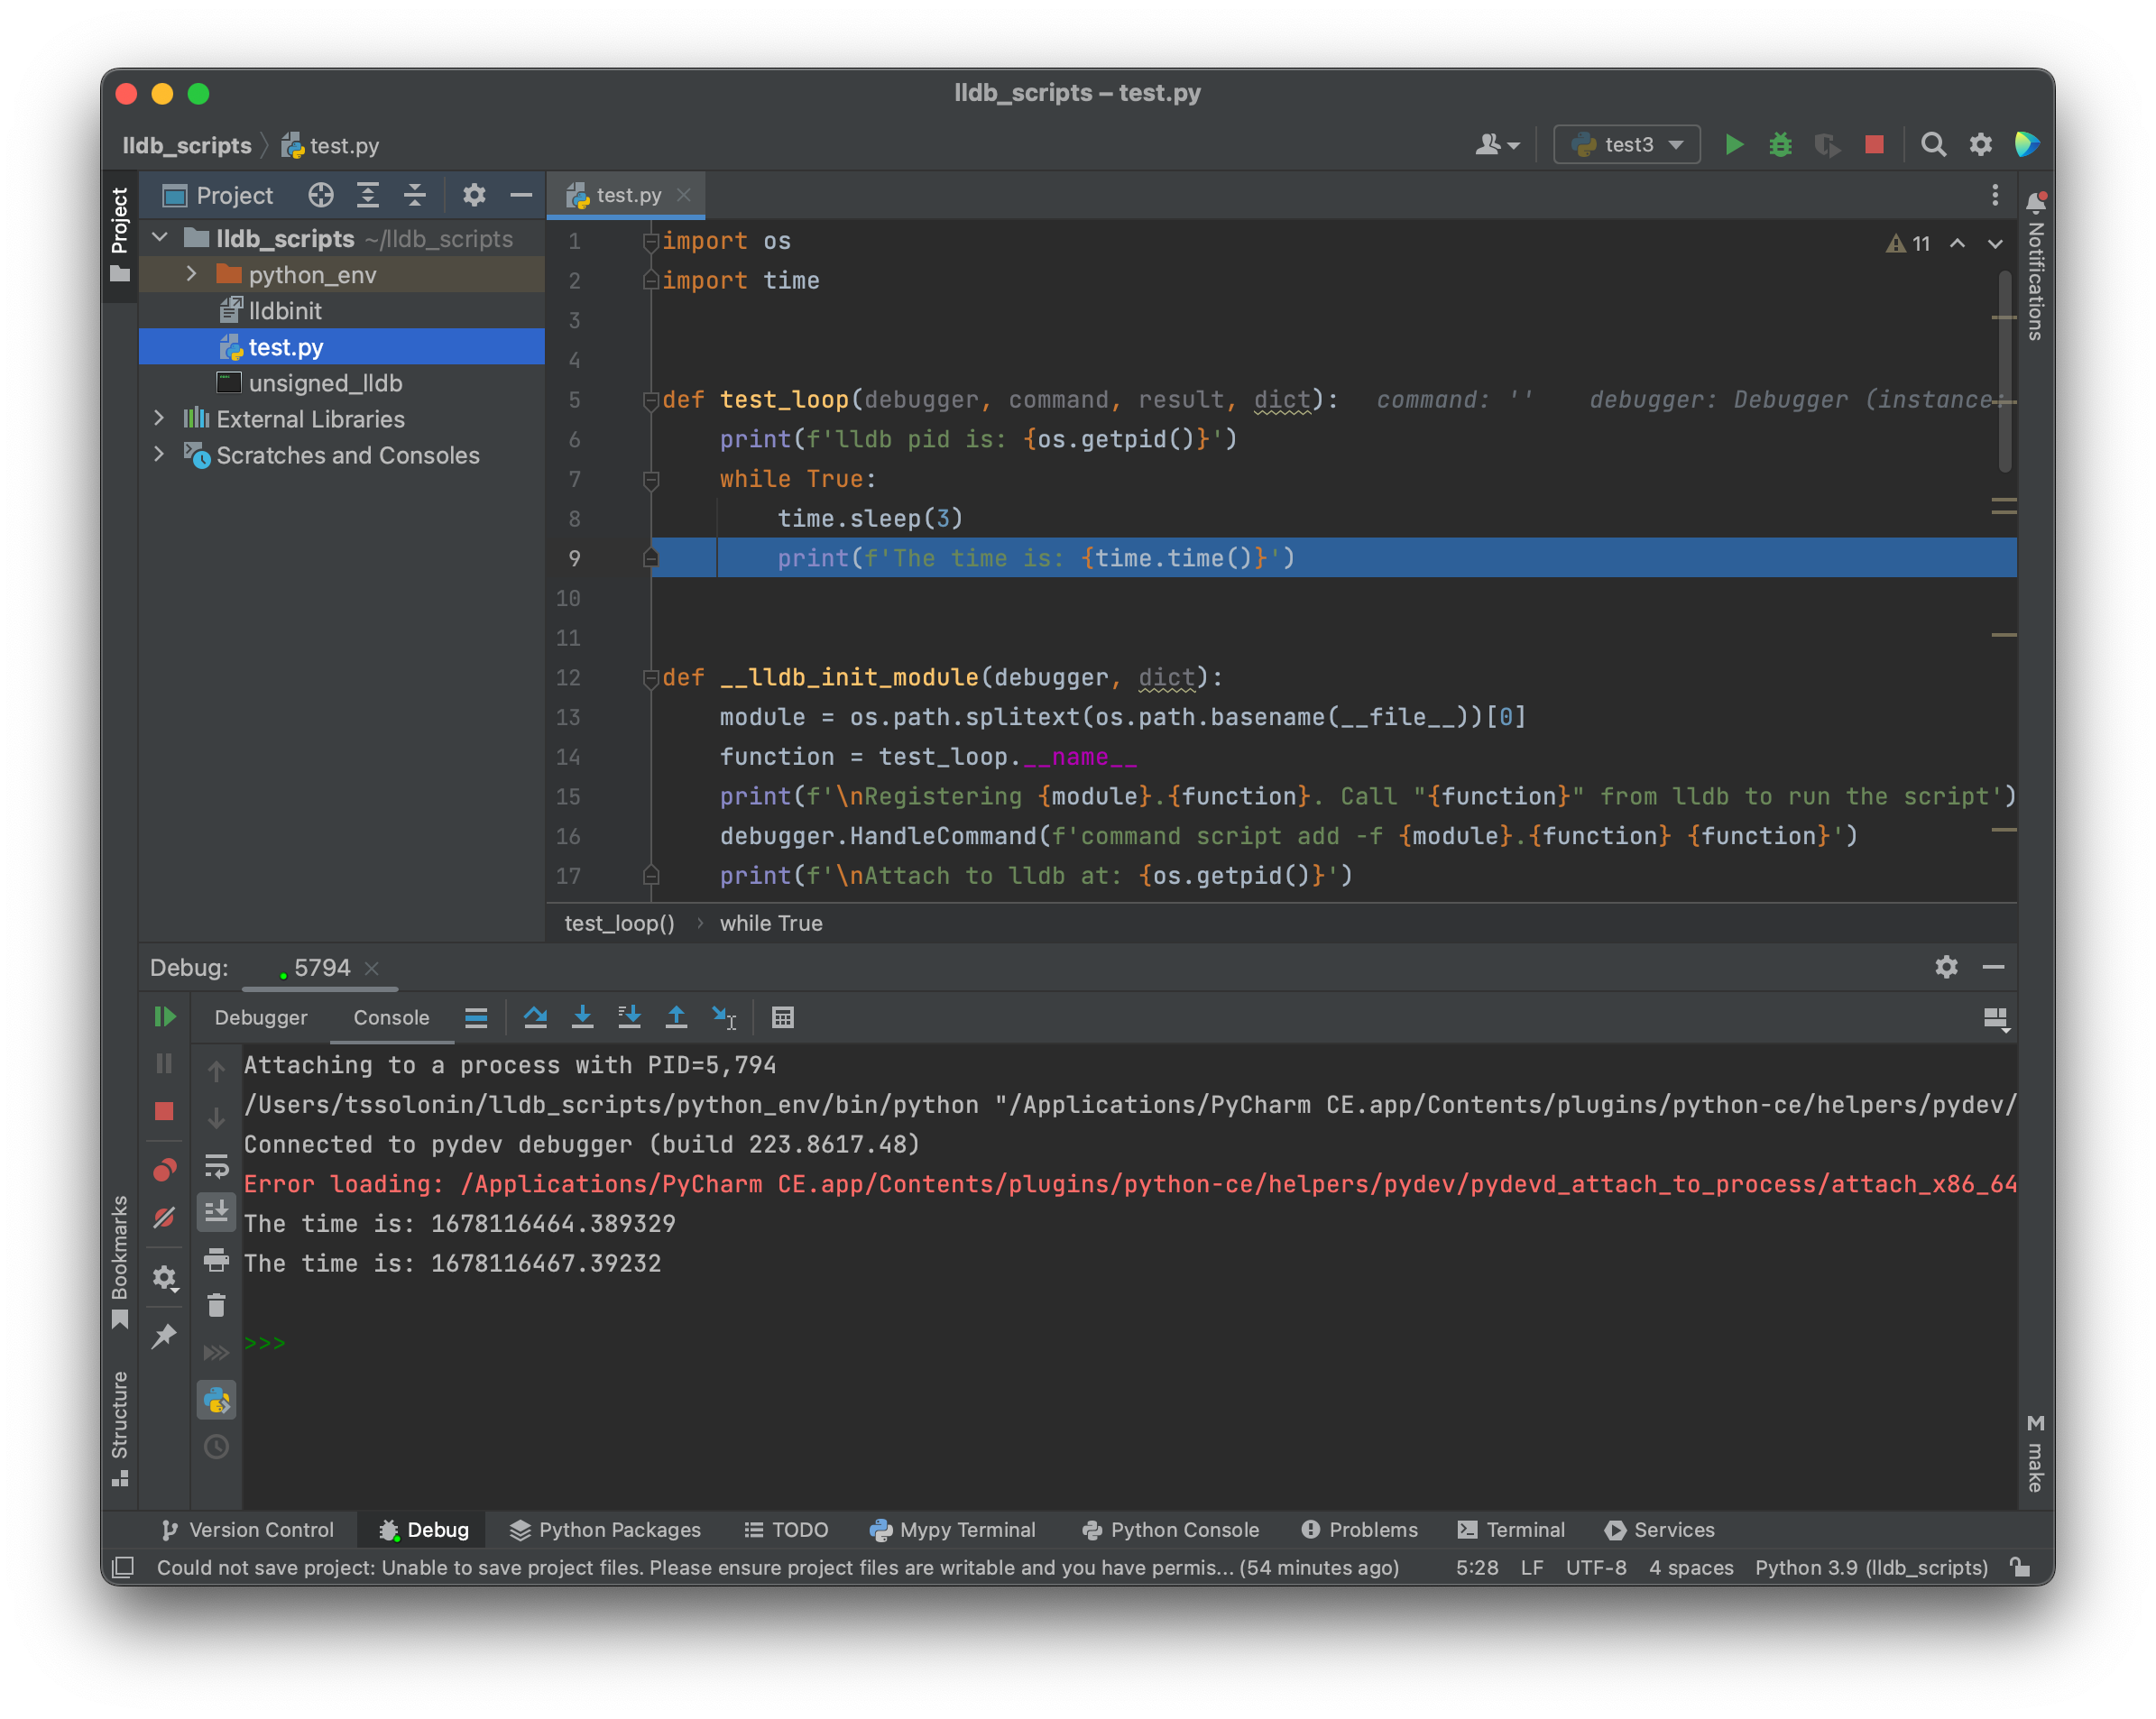
PyCharm still tries to inject the Intel library, but everything works out since we preloaded the DoAttach function.
Working in PyCharm
UPD: I was originally using pydevd.settrace() to break execution. Actually there is need no call pydevd API directly, just set a breakpoint in PyCharm and execution will break as usual.
But here is how you could tinkerer with pydevd directly from lldb
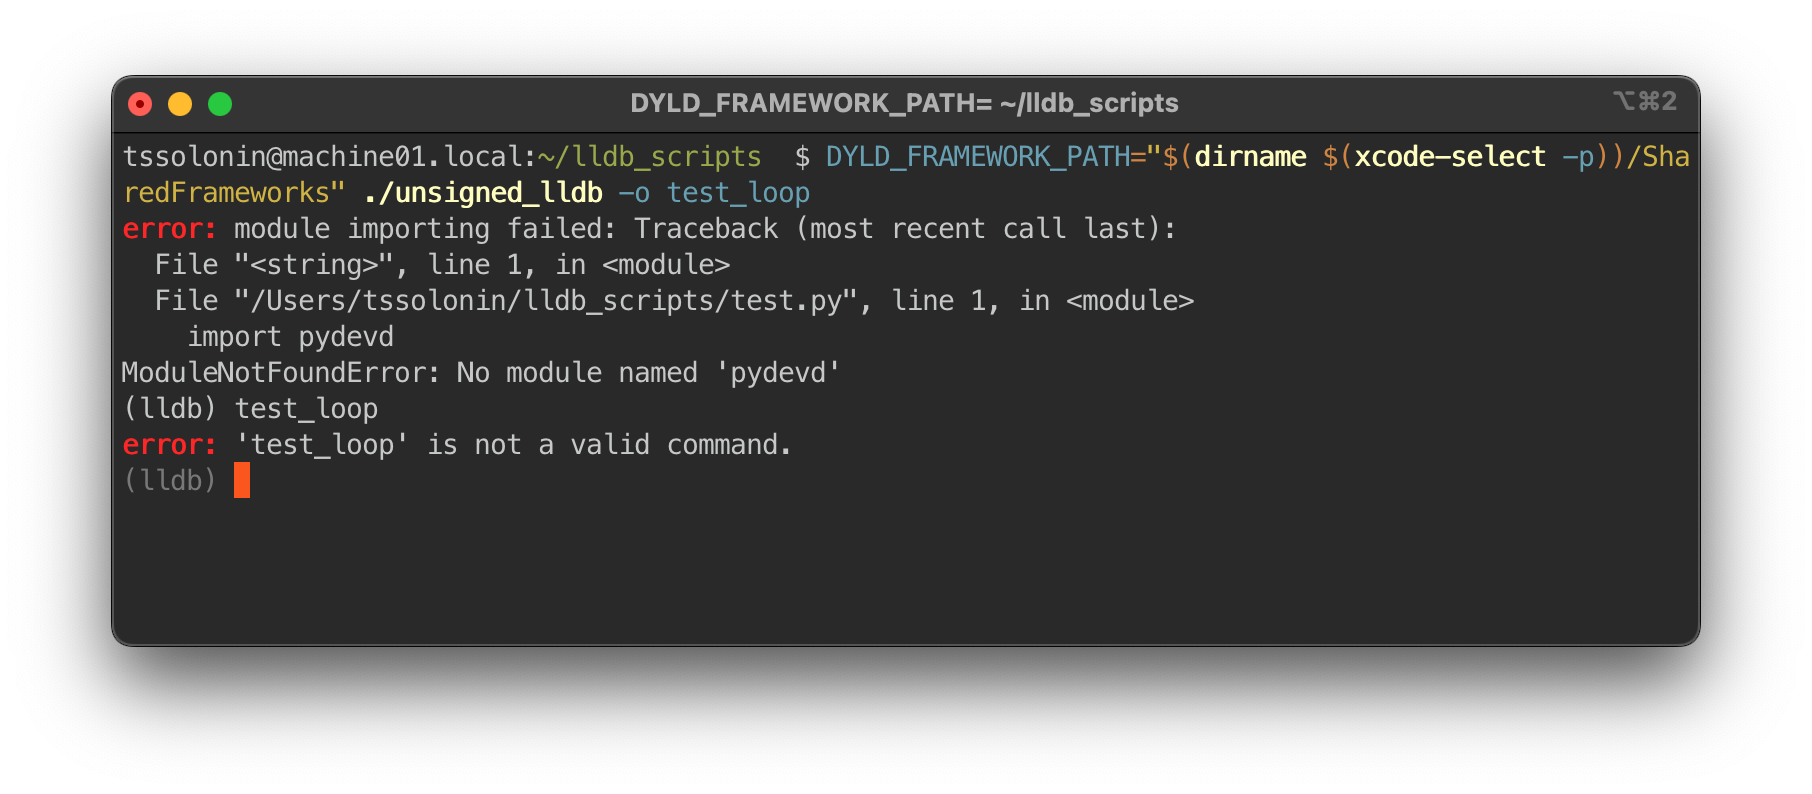
The issue is that neither the project in PyCharm, where we work on the script, nor lldb, where the script executes, know anything about pydevd APIs. If we stick import pydevd into the script, nothing works:
Let’s first fix the lldb runtime. On my PyCharm CE pydevd is located in:
/Applications/PyCharm CE.app/Contents/plugins/python-ce/helpers/pydev
To make the pydevd module accessible to the lldb runtime, we need to add this directory to the python module search paths using the sys.path API. Try adding the following lines at the beginning of test.py:
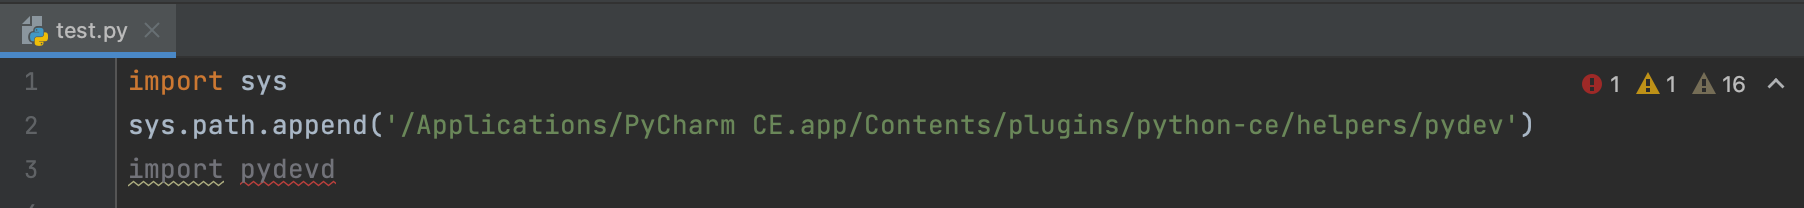
The lldb -o test_loop command is working again!
To make PyCharm aware of the API do:
$ echo '/Applications/PyCharm CE.app/Contents/plugins/python-ce/helpers/pydev' > "$(echo python_env/lib/python*)/site-packages/pydev.pth"
We can now import pydevd. Go to the test_loop function and rewrite it to:
import os
import sys
sys.path.append('/Applications/PyCharm CE.app/Contents/plugins/python-ce/helpers/pydev')
from lldb import SBDebugger, SBCommandReturnObject
from pydevd import settrace

def test_loop(
    debugger: SBDebugger,
    command: str,
    result: SBCommandReturnObject,
    dict
):
    settrace()
    print(command)
    print(debugger.GetSelectedTarget())
    result.AppendWarning(f'Warning from {test_loop.__name__}')
    print('')
Now that all platforms are attachable, we need to make PyCharm aware of the lldb API. One way to do that is to create a pth pointer in the site-packages:
$ echo "$(dirname $(xcode-select -p))"/SharedFrameworks/LLDB.framework/Versions/A/Resources/Python > "$(echo python_env/lib/python*)/site-packages/lldb.pth"
Finally, import lldb works, and we are able to explore the API with proper code-completions.
To attach to this script, do the following steps:
- Launch
lldb - Attach PyCharm to the
lldbprocess - Set a breakpoint
- Call the command from
lldb
PyCharm will break at the breakpoint. This is what it should look like:
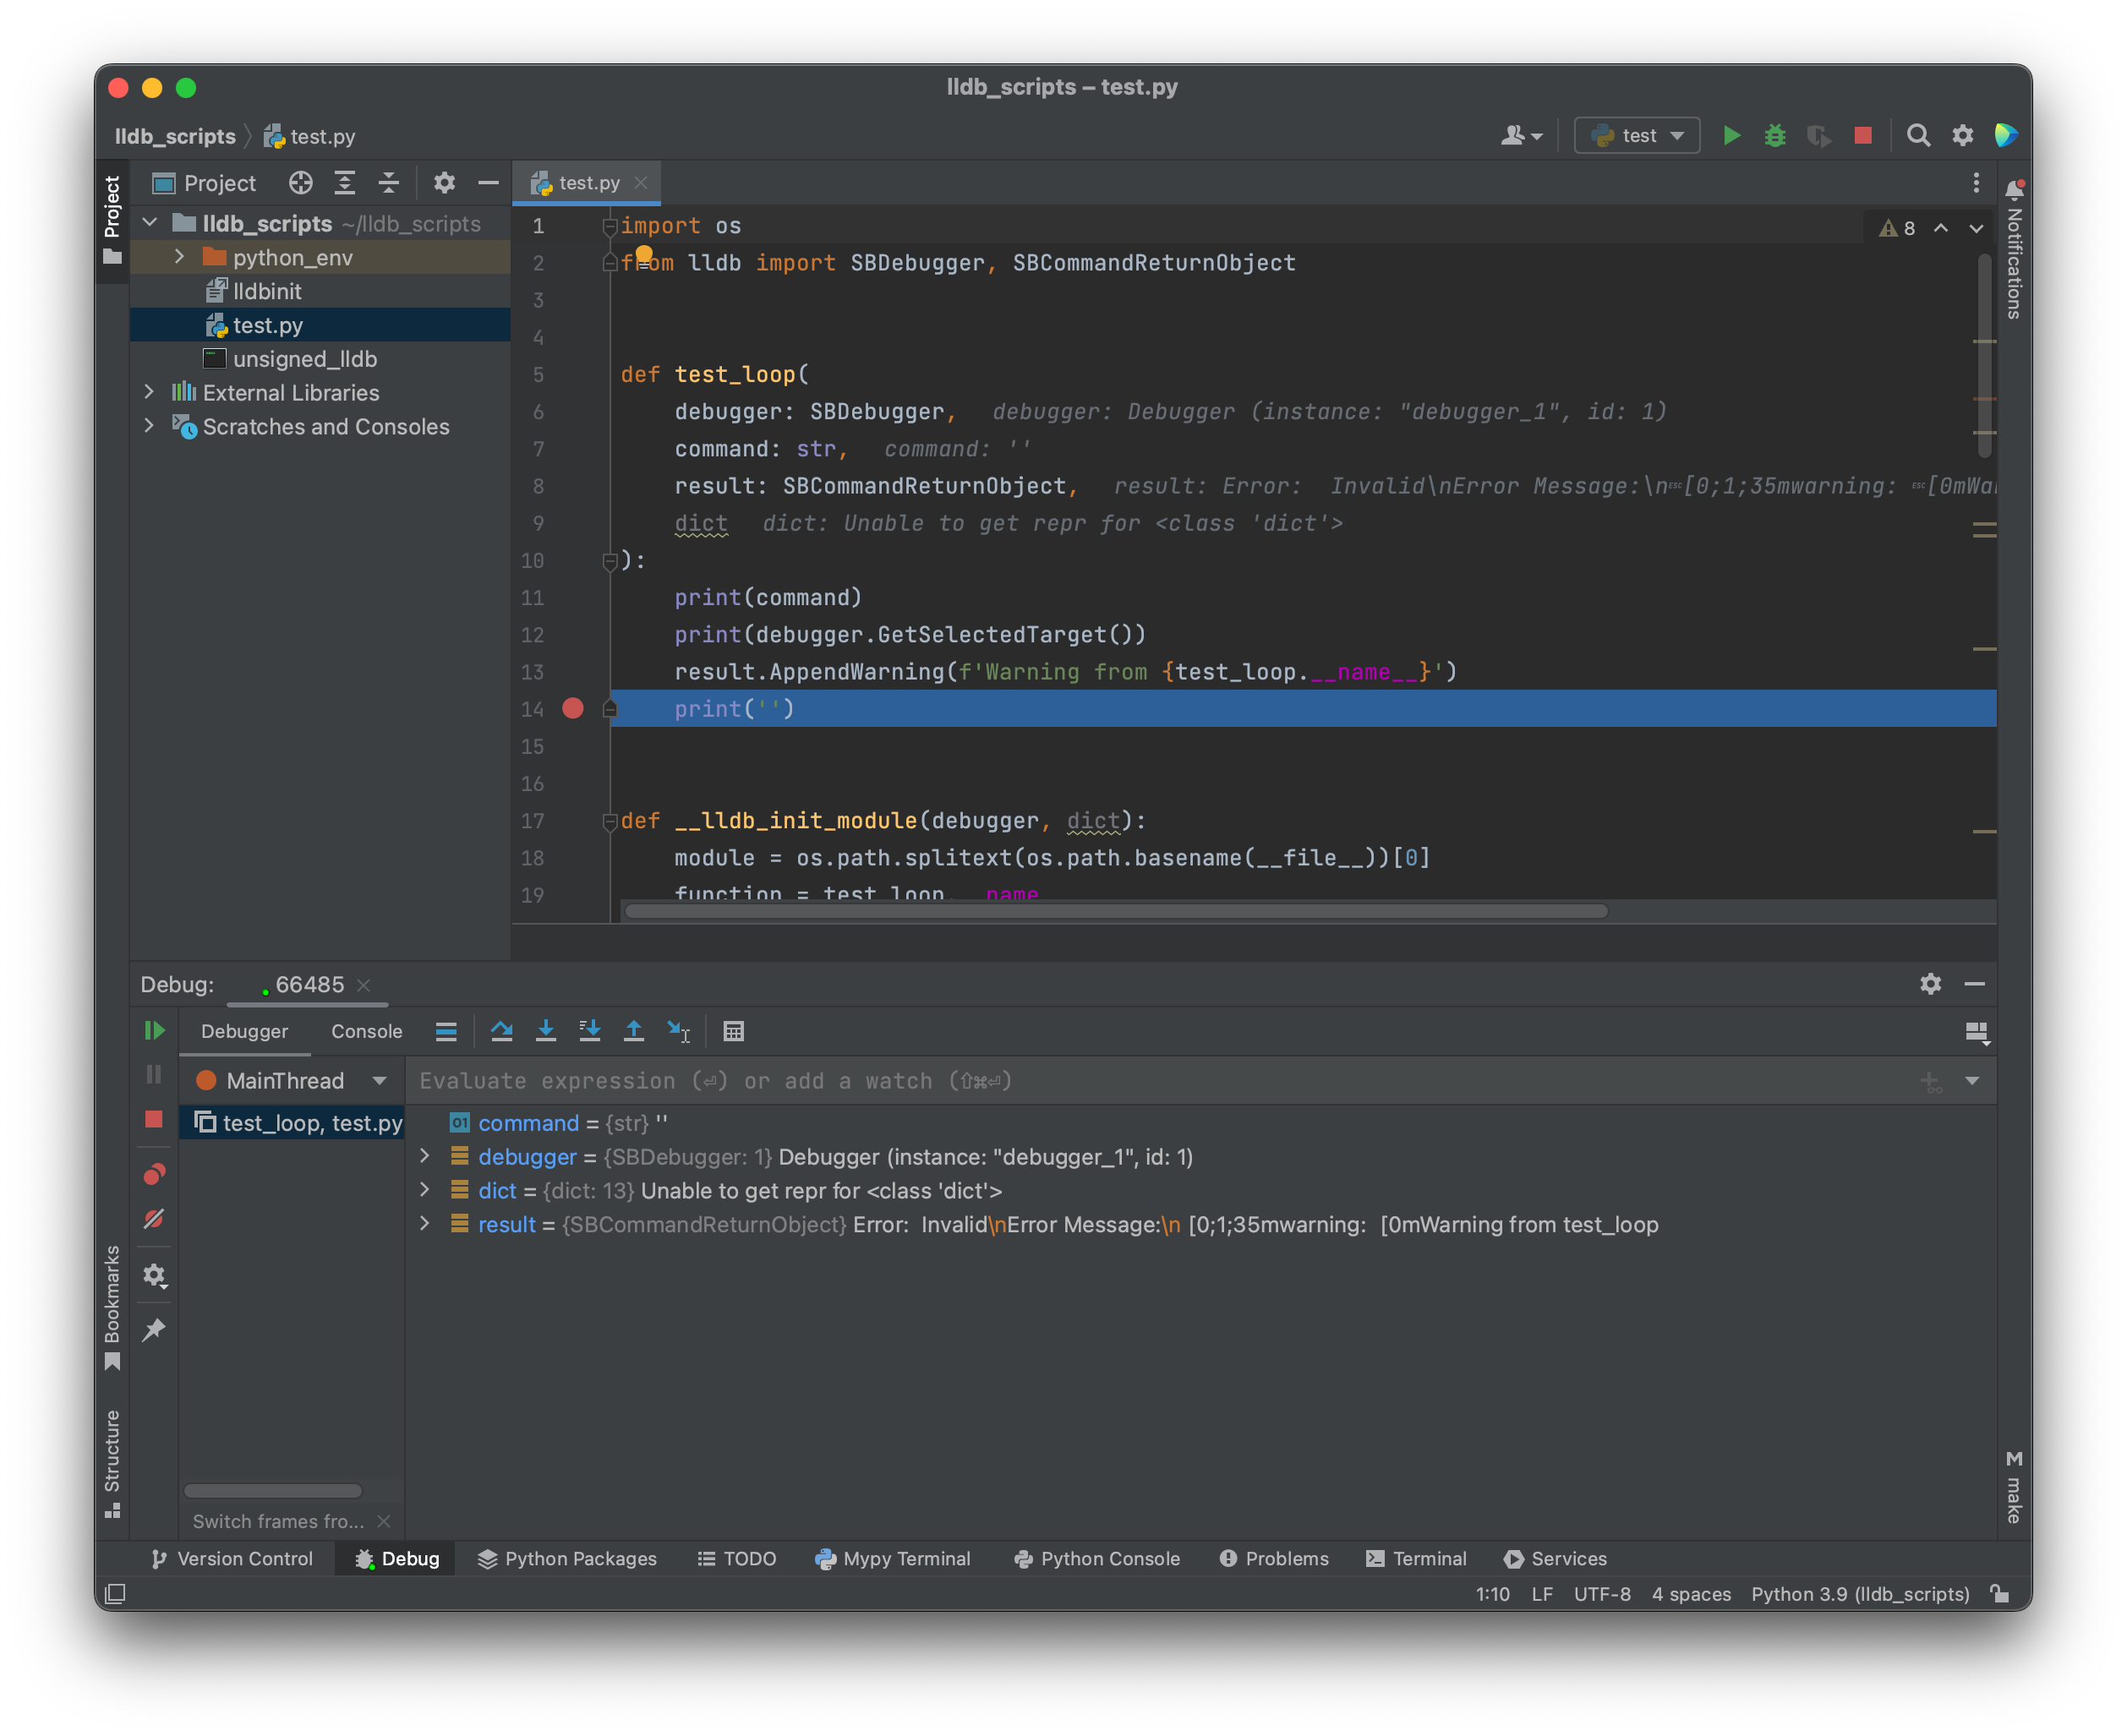
🎉
Scripting examples
With the might of PyCharm in our hands, let’s slap together some useful scripts.
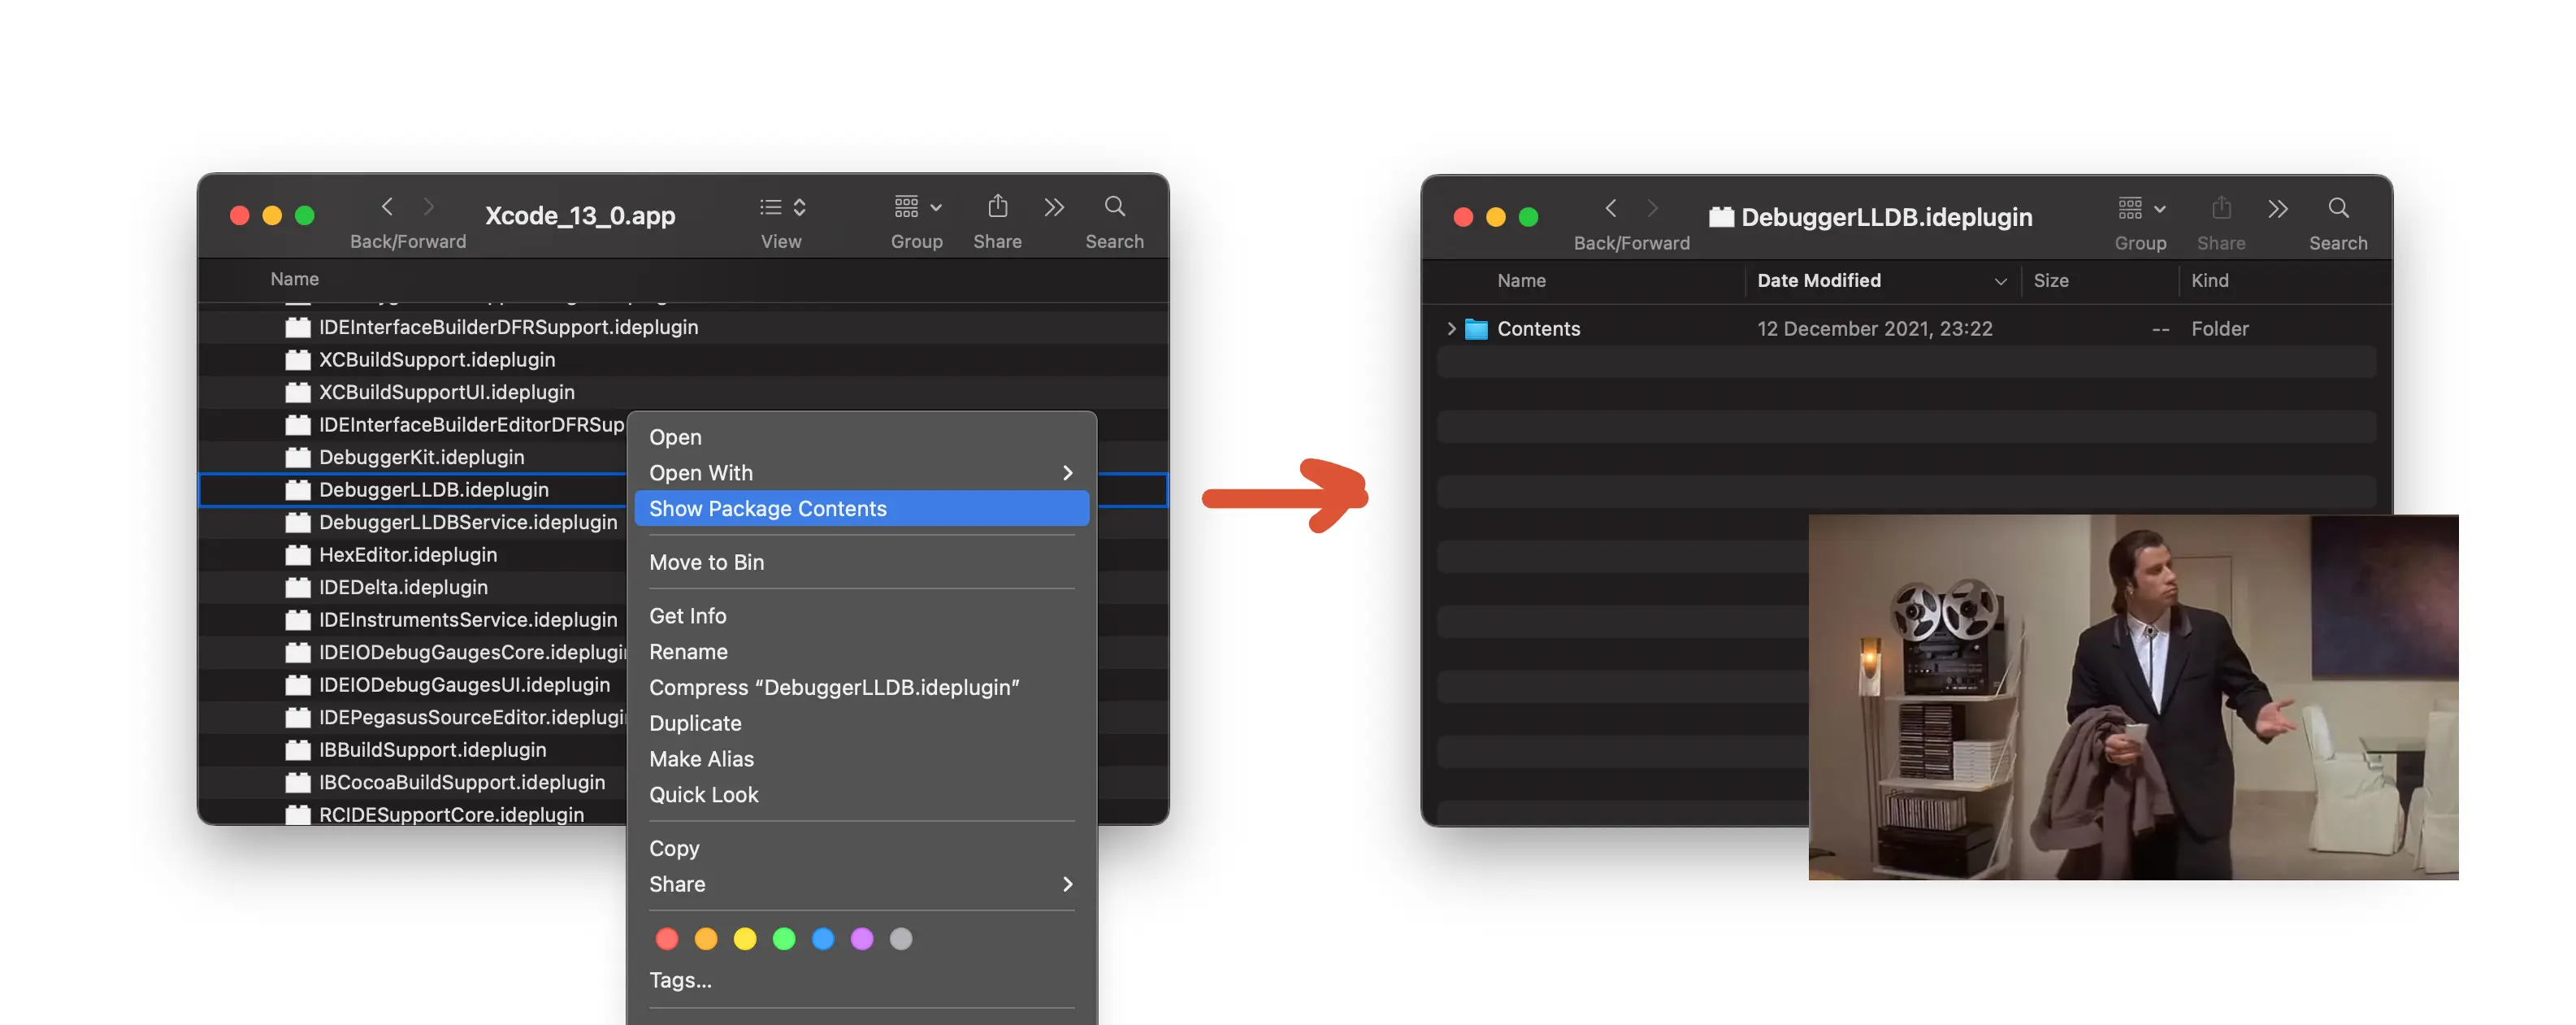
How about this one for automating the Finder hack?
In addition to commands, it is also possible to script breakpoints. Let’s dump an image of a view any time viewDidAppear is called by reading a pointer from the Objective-C method and generating a Swift expression using Python.
Amazing!
]]>